fluTAS 2020 Report 4
Public Health Services produce the fluTAS Report to provide information about the level of influenza (flu) in Tasmania. Several surveillance data sources are used to obtain measures of influenza activity in the community.
This surveillance report describes influenza activity in Tasmania during the period 1 January 2020 to 2 August 2020 (week 31).
Data considerations
It is important to note that due to the COVID-19 epidemic in Australia, data reported from the various influenza surveillance systems may not represent an accurate reflection of influenza activity. Results should be interpreted with caution, especially where comparisons are made to previous influenza seasons. Interpretation of 2020 influenza activity data should take into account, but is not limited to, the impact of social distancing measures, likely changes in health seeking behaviour of the community including access to alternative streams of acute respiratory infection specific health services, and focussed testing for COVID-19 response activities. Current COVID-19 related public health measures and the community’s adherence to public health messages are also likely having an effect on transmission of acute respiratory infections, including influenza.
2020 summary: 1 January to 2 August
- There have been 160 laboratory-confirmed influenza notifications in Tasmania to date this year.
- There were relatively high notifications at the beginning of the year compared to previous years before decreasing in mid-March and remaining low.
- This decline in notifications coincided with the physical distancing policies, implemented by the Commonwealth and Tasmanian Governments during March 2020 in response to the COVID-19 pandemic.
- A similar decline in influenza notifications has been observed nationally.
- Influenza A has been the predominant circulating influenza virus with 139 notifications (87%) to date.
- 7 732 polymerase chain reaction (PCR) tests for influenza have been conducted, reflecting intensive testing in response to COVID-19.
- Despite intensive testing, only three per cent of these PCR tests have been positive for influenza.
Notifications of laboratory-confirmed influenza to Public Health Services
Influenza notifications are based on positive laboratory tests. Many people with influenza-like illness choose not to attend medical care or are not tested when they attend. Notifications therefore represent a small proportion of the total influenza cases in the community.
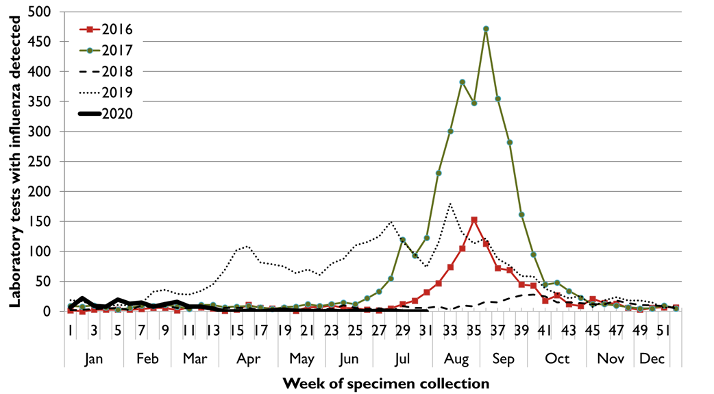
From 1 January to 2 August 2020 (week 31), Public Health Services received 160 laboratory confirmed notifications of influenza. This is 44 per cent lower than the 3-year (2016-2018) average of 288 notifications and 92 per cent lower than the 1 928 notifications received in 2019 over the same time period. As shown in Figure 1, 2019 was characterised by an early start to the influenza season with notifications increasing dramatically from March.
Monthly influenza case numbers were relatively high during January and February of 2020 compared to previous years before decreasing in mid-March and remaining low (Figure 1). This decline coincided with the social distancing policies, implemented by the Commonwealth and Tasmanian Governments during March 2020 in response to the COVID-19 pandemic. Since the last FluTAS Report (for the period ending 28 June 2020) only two laboratory-confirmed influenza notifications have been received in Tasmania. A similar decline and pattern of low influenza notifications has been observed nationally.

Influenza testing
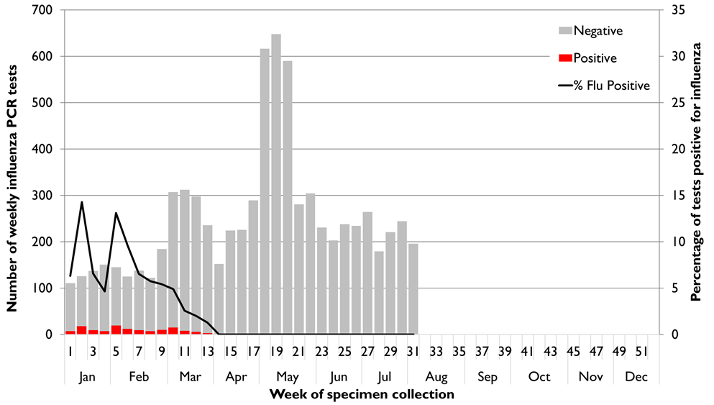
There has been an increased focus on laboratory testing this year in response to the COVID-19 pandemic with 7 732 polymerase chain reaction (PCR) tests conducted between 1 January and 2 August 2020. As shown in Figure 2, influenza testing increased dramatically in March and peaked in early May with 648 tests conducted in week 19. 1 104 PCR tests have been conducted since the last FluTAS Report (for the period ending 28 June 2020).
Proportion of tests positive for influenza
Despite this increased focus on testing, the average weekly proportion of tests positive for influenza so far this year is only three per cent, ranging from 0 to 14 per cent. As shown in Figure 2, the percentage of positive tests peaked in week 2 at 14 per cent and week 5 at 13 per cent before gradually declining to 0 per cent. There have been no positive PCR tests in Tasmania since March 29 (week 13).

Other circulating respiratory illness
Many viruses cause the ‘common cold’ and ‘influenza-like illnesses’. The Royal Hobart Hospital (RHH) laboratory performs a PCR test that detects influenza A and influenza B viruses, as well as seven other respiratory pathogens commonly associated with respiratory illness.
RHH performed 3 334 PCR tests between 1 January and 2 August 2020. The most commonly detected respiratory viruses this year are rhinovirus (66 per cent), parainfluenza (9 per cent) and adenovirus (9 per cent). Since the last FluTAS Report (for the period ending 28 June 2020), rhinovirus has accounted for 86 per cent and adenovirus for 10 per cent of respiratory viruses detected.
Geographical distribution of activity
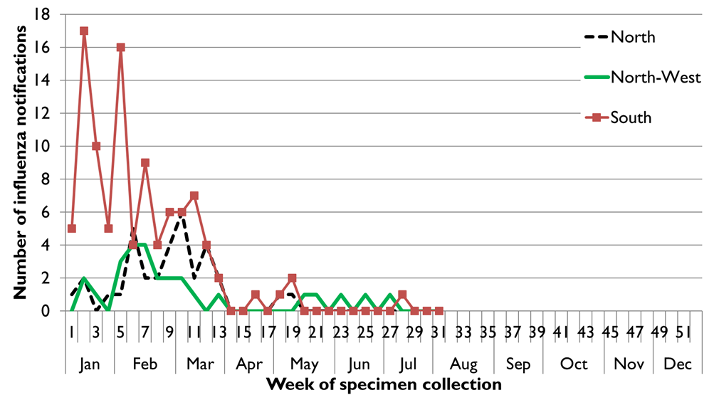
Of the 160 notified cases of influenza in Tasmania so far this year, 94 cases (59 per cent) were from the South, 34 cases (21 per cent) from the North and 27 cases (17 per cent) from the North West. Three overseas visitors and one interstate resident have been diagnosed with influenza in Tasmania this year.

Virology
Influenza A has been the predominant circulating influenza virus so far this year with 139 notifications (87%). A small proportion of influenza A viruses undergo further subtyping. Of the 44 cases that were subtyped, 42 (95 per cent) were influenza A (H1N1) and two were influenza A (H3N2). The remaining 21 cases (13 per cent) are attributed to influenza B.
At-risk populations
So far this year, notification rates have been highest in adults aged 50-64 (41 notifications per 100 000 population) and lowest in children aged less than 10 years (16 notifications per 100 000 population). Influenza A accounts for the greatest number of notifications across all age groups with 26 notifications per 100 000 population.
Influenza-like illness
FluTracking (Community Syndromic Surveillance)
FluTracking is a national, weekly online survey that asks participants to report whether they have had fever and/or cough in the preceding week. It is a joint initiative of the University of Newcastle, Hunter New England Population Health and the Hunter Medical Research Institute. FluTracking information is available at FluTracking website and on FluTracking Facebook page
Annual influenza vaccine
Composition of 2020 influenza vaccines
The annual influenza vaccine is reviewed late each year, aiming to produce vaccines for the following year that provide protection from influenza strains likely to be common during winter. Advice on the formulation of annual influenza vaccines is provided to the Therapeutic Goods Administration (TGA) by the Australian Influenza Vaccine Committee (AIVC).
This AIVC recommendation for the composition of influenza vaccines for Australia in 2020 introduces a new A (H1N1) like virus strain, a new A (H3N2) like virus strain and a new strain for the B Victoria lineage when compared to the composition of the trivalent and quadrivalent vaccines for Australia in 2019.
Further information on the composition of influenza vaccines is available on the TGA website
Is vaccination recommended?
Annual influenza vaccination is the most important measure to prevent influenza and its complications and is recommended for all people ≥6 months of age. Annual vaccination can help to reduce the spread of influenza and protect vulnerable members of the community.
Influenza vaccines in 2020 are free* in Tasmania for people at greater risk of contracting and developing severe complications from influenza. Free vaccine is available through General Practitioners for the following people:
- All children aged from six months to under five years
- All Aboriginal and Torres Strait Islander people aged 6 months and over
- Adults aged 65 and over
- Pregnant women at any stage in their pregnancy
- Adults and children aged from 6 months with chronic medical conditions such as heart, lung, liver or kidney diseases, asthma, diabetes, cancer, impaired immunity and neuromuscular conditions
More information about immunisation in Australia is available on the national Department of Health and Aged Care website.
*Please note there may be a consultation fee for the healthcare provider to administer the vaccine.
Figure 1
Figure 1 is a line graph with a horizontal axis indicating the 52 weeks of the year. The vertical axis indicates the number of laboratory confirmed flu cases notified in Tasmania for each week of the year. Lines for each of the three years 2016, 2017 and 2018 each indicate low baseline flu activity between January and May as well as between November to December. The line for each year indicates that the peak of the flu season usually occurs between July and October. The line for 2017 indicates a year of high flu activity in Tasmania with a weekly peak above 450 flu cases occurring during August and September 2017. The line for 2018 indicates a year of very low flu activity with a peak of approximately 25 flu cases during early October 2018. The line for 2019 indicates that weekly flu cases were well above baseline levels between the middle of February and the middle of July. Activity was high early in the year with a high of 109 cases mid-April. Activity then decreased and increased steadily from 1 June to mid-July before decreasing again until the start of August. Weekly flu cases peaked again with a high of 180 cases during the middle of August before decreasing to the end of the year. The line indicating flu cases in Tasmania for 2020 shows relatively high notifications at the beginning of the year compared to previous years before decreasing in mid-March and remaining low.
Figure 2
Figure 2 is a combined line and vertical bar graph. The horizontal axis indicates the months and weeks of 2020 moving left to right. The vertical axis on the left-hand side is the number of influenza polymerase chain reaction or PCR tests conducted per week (represented by bars in the figure). Each bar is split into two colours: positive tests are at the bottom of the bar, with negative tests stacked on top of the bar. The vertical axis on the right-hand side is the percentage of PCR tests that are positive for influenza (represented by a line overlaid on top of the bar graph in the figure). Data are currently presented for the first 26 weeks of 2020; 1 January to 28 June. The bar graph indicates an increase in testing in Tasmania during March and April. Influenza testing peaked at the end of April with 601 tests conducted in week 18. The percentage of positive tests peaked in week 2 at 14 per cent and week 5 at 13 per cent before gradually declining to nil positive tests. There have been no positive PCR tests in Tasmania since March 29 (week 13).
Figure 3
Figure 3 is a line graph with a horizontal axis indicating the 52 weeks of the year. The vertical axis indicates the number of laboratory confirmed flu cases notified in each region of Tasmania for each week of the year. Lines for each of the three regions, North, North-West and South, show that 59 percent of cases were reported in the South, 21 percent of cases were reported in the North and 17 percent of cases were reported in the North-West.
Document accessibility
We aim to provide documents in an accessible format. If you are having problems using a document with your accessibility tools, please contact us for help.
